Page: 1
/
64
Total 317 questions
Curious about Actual Tableau Desktop Specialist (TDS-C01) Exam Questions?
Here are sample Tableau Desktop Specialist (TDS-C01) Exam questions from real exam. You can get more Tableau Desktop Specialist (TDS-C01) Exam premium practice questions at TestInsights.
Question 1
What should you use to apply bold text formatting to rows or columns independent of each other?
Correct : C
To apply bold text formatting to rows or columns independently in Tableau, you should use the Rows tab or the Columns tab on the Format Font pane. This approach provides control over the formatting of text within individual rows or columns. By selecting the appropriate tab (Rows or Columns), you can apply formatting settings, including bold text, to only the selected rows or columns. This is a crucial feature for enhancing the readability and visual appeal of specific parts of a Tableau worksheet, allowing for emphasis on particular data points or categories.
Start a Discussions
Submit Your Answer:
Question 2
You want to update the font of an entire workbook.
What should you use to configure the default fonts?
Correct : B
To update the font of an entire workbook in Tableau, you should use the 'Format Workbook' pane. This feature allows you to set and modify the default font settings for the entire workbook, ensuring consistency in font style across all sheets and dashboards. It's a global setting that applies to all visual elements in the workbook, including titles, captions, axis labels, and other text elements.
Start a Discussions
Submit Your Answer:
Question 3
Which two elements can have their values changed by using a dashboard action? Choose two.
Correct : C, D
In Tableau, the two elements that can have their values changed by using a dashboard action are Sets and Parameters. Dashboard actions can be configured to modify the values within a set or a parameter, allowing for interactive and dynamic changes in the visualization based on user interactions. For example, selecting a specific data point in a dashboard can trigger an action that updates a set or changes the value of a parameter, which in turn can alter the displayed data or the appearance of visualizations within the dashboard.
Start a Discussions
Submit Your Answer:
Question 4
You have the following visualization.
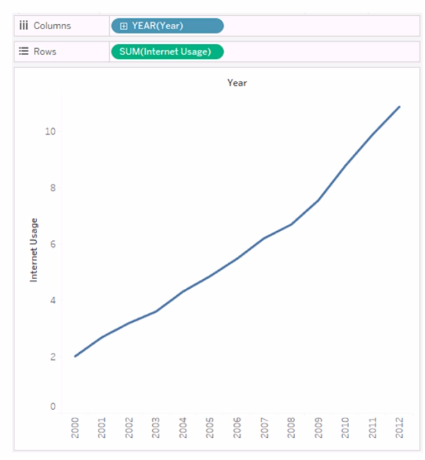
You need to show how Internet Usage values change from year-to-year as a percentage. Which quick table calculation should you apply to the Internet Usage field?
Correct : B
To show how Internet Usage values change from year to year as a percentage, you should apply the 'Percent Difference' quick table calculation to the Internet Usage field. This calculation compares each value to the previous value and computes the difference as a percentage, which is ideal for analyzing the rate of change over a sequential time period such as consecutive years.
Start a Discussions
Submit Your Answer:
Question 5
What are two outcomes when you drag a continuous date value to the Rows shelf? Choose two,
Correct : A, C
Dragging a continuous date value to the Rows shelf in Tableau results in a green pill on the Rows shelf, indicating a continuous field. It also results in a quantitative axis being displayed on the visualization. Continuous fields are used to create axes on charts and can represent a range of values smoothly. This is opposed to discrete date values, which would be represented by a blue pill and typically show headers or labels rather than a continuous axis.
Start a Discussions
Submit Your Answer: